MAX-IV ELK stack application
For a description of an example installation of MAX-IV like deployment, see the training VM documentation.
The integration with ELK stack let provide easy to configure visualisation dashboards as well as data analysis tools.
One can use it to provide info on KPIs like alarm’s frequency, average, maximum and minimum response time, and so.
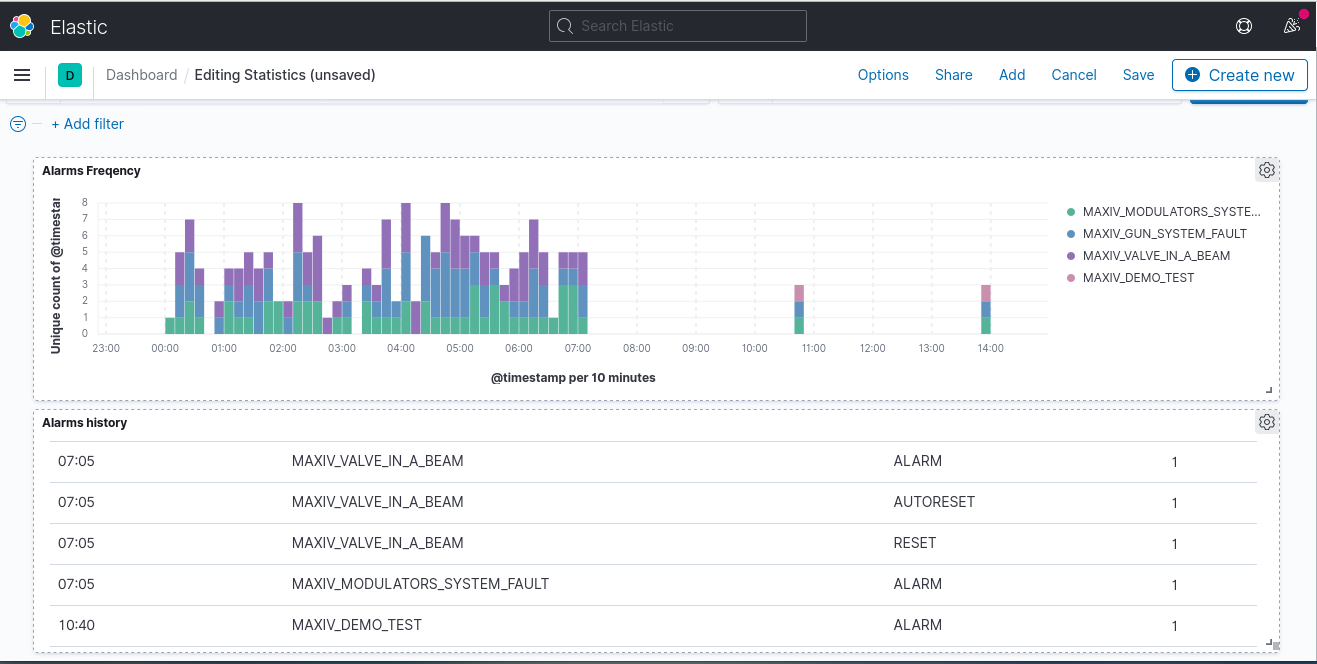
Fig. 15 An example Kibana dashboard showing alarm data
A demo of MAX-IV deployment
The demo is available on the training virtual machine. It is disabled from automatic startup to prevent resources consumption.
To start the demo, please run the script:
/home/panic/demo/maxiv/start.sh
The script starts the MAX-IV device server and services. The startup asks for sudo password.
After the services and MAX-IV PyAlarm is started, you can access the Kibana with a browser (i. e. firefox) on address: http://training:5601.
MAX-IV app description
MAX-IV uses its version of PyAalrm extended with a facility to send alarms’ events to the Logstash/Elasticsearch. The DS is based on an old PyAlarm version (4.22.13).
Note
There is a related pull request sent bt MAX-IV for PANIC mainstream repository. Due to in-meantime advance in PANIC development, the PR cannot be easily merged. It requires a bit of rewriting.
A MAX-IV device sends alarm information, packed into a JSON object to a Logstash server listening on the 5959 TCP port and address provided by its LogStash property.
The Logstash push the data to the Elsticsearch database according to its configuration.
The data available in the Elasticsearch database can be browsed with the Kibana web application.
The Kibana provides tools for data browsing, filtering, aggregating and visualising. Please reffer to Kibana documentation
Deployment
To make the setup work one need to:
install and configure ELK stack:
Elasticsearch,
Logstash,
Kibana,
provide a dedicated logstash configuration file,
Install MAX-IV version of the PyAlarm device server, configure a PyAlarm device and set its LogStash property.
Logstash configuration example
To let PyAlarm send alarms to the Elasticsearch, a logstash configuration file (pipeline) has to be provided, so the Logstash accepts a JSON data on 5959 TCP port. The configuration file may look like the following:
input {
tcp {
    port => 5959
    codec => json
}
}
output {
    elasticsearch {
        hosts => ["localhost:9200"]
        index => "tango-alarms-%{+YYYY.MM.dd}"
        document_type => "alarm"
    }
}